Sainsbury's Gingerbread Blondie Pies, Taste the Difference


Sainsbury's Gingerbread Blondie Pies, Taste the Difference
Nutritional Information
Data Confidence 5/5
Calories kCal
227.5
5.3
11.4
Carbohydrate g
25.2
of which Sugars g
11.1
Fibre g
0.9
Carbohydrate Fibre Ratio %
3.6
Fat g
12.7
of which Saturates g
5.8
Protein g
2.8
Salt g
0.1
Calorie Density kCal/g
4.79
Calories from Carbs kCal
101.2 (44.5%)
Calories from Protein kCal
11.1 (4.9%)
Calories from Fat kCal
115.1 (50.6%)
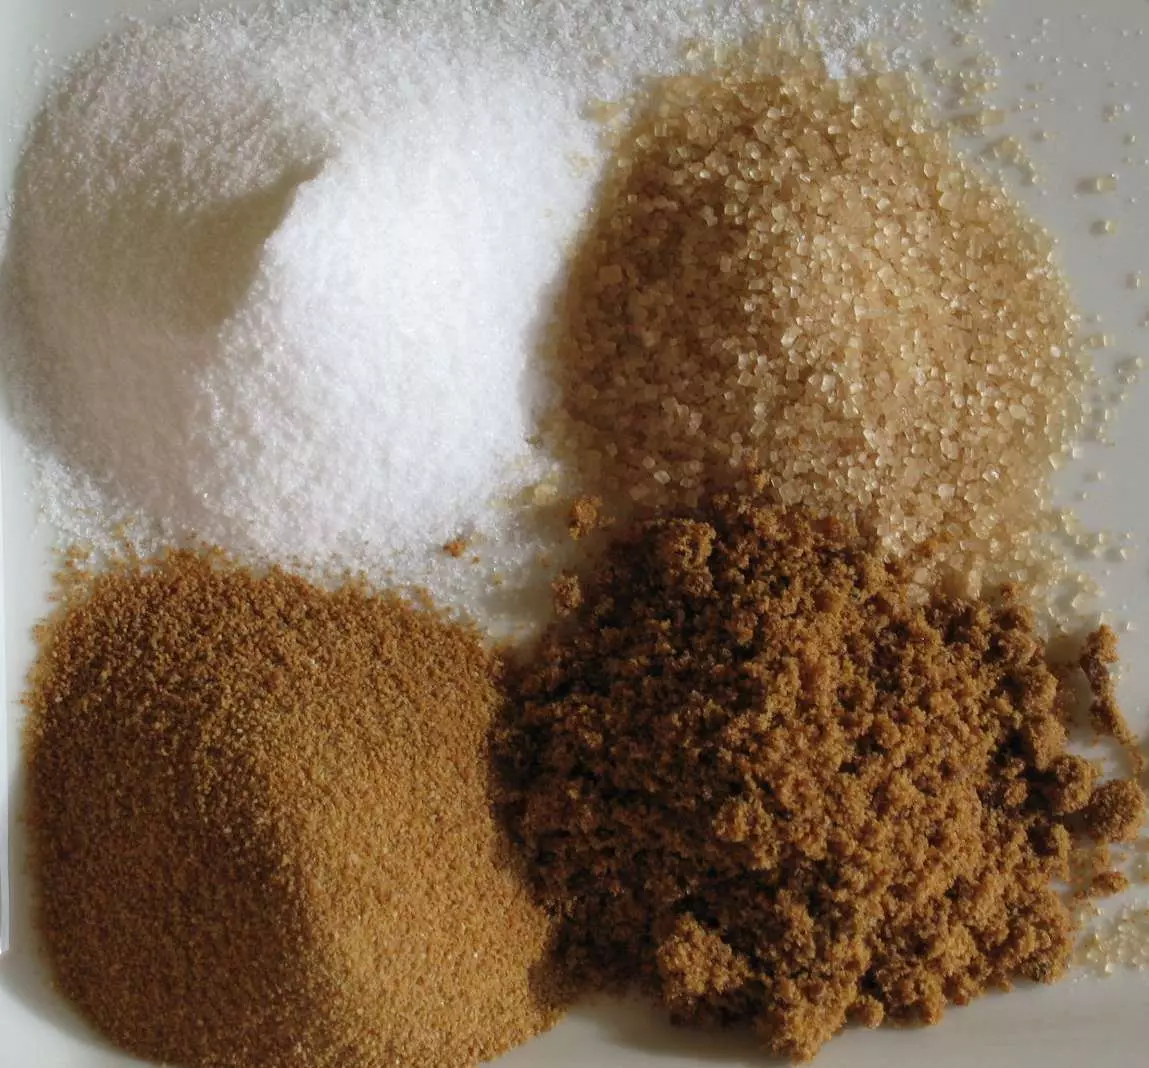
= up to 4g of sugar
Ingredients Fortified British Wheat Flour (Wheat Flour, Calcium Carbonate, Niacin, Iron, Thiamin), Caramel Filling (21%) (Glucose Syrup, Sweetened Condensed Cows' Milk (Cows' Milk, Sugar), Sunflower Oil, Rapeseed Oil, Humectant: Glycerol; Golden Syrup, Colour: Plain Caramel; Water, Clarified Butter (Cows' Milk), Salt, Flavouring), Butter (Cows' Milk) (21%), Sugar, Pasteurised Free Range Egg, Ground Almonds, White Chocolate Chips (3.5%) (Sugar, Whole Cows' Milk Powder, Cocoa Butter, Skimmed Cows' Milk Powder, Emulsifier: Soya Lecithin; Flavouring), Partially Inverted Sugar Syrup, Treacle, Ginger Powder, Salt, Flavourings, Raising Agent: Ammonium Bicarbonate
Tracking what you eat is proven to help you lose weight and you can do it for free with my caloriestar app
How many calories in Sainsbury's Gingerbread Blondie Pies, Taste the Difference?
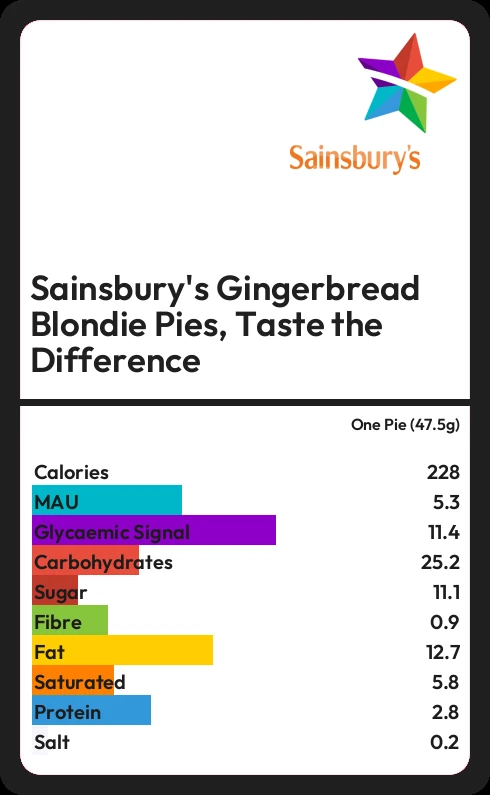
Sainsbury's Gingerbread Blondie Pies, Taste the Difference contains 227.5 calories in one Pie (47.5g).
How much sugar in Sainsbury's Gingerbread Blondie Pies, Taste the Difference?
Sainsbury's Gingerbread Blondie Pies, Taste the Difference contains 11.1g sugar in one Pie (47.5g) - that is around 3 cubes of sugar.
How much fat in Sainsbury's Gingerbread Blondie Pies, Taste the Difference?
In one Pie (47.5g) of Sainsbury's Gingerbread Blondie Pies, Taste the Difference there are 12.7g of fat of which 5.8g are saturated.


